Enhanced polytomy resolution strengthens evidence for global gradient in speciation rate for marine fishes
Highlights
- We updated the set of all-taxon assembled (ATA) phylogenies by improving monophyly constraints
- We compare the original and updated ATA phylogenies and re-analyze results from Rabosky et al. 20181
- These updates strengthen support of our original findings based on the λDR speciation rate statistic
Introduction
We recently documented an inverse global gradient in speciation rate for marine fishes, such that speciation rates are consistently elevated for high-latitude temperate and polar fishes relative to their tropical counterparts1. We demonstrated that multiple estimators of speciation rate (λBAMM, λDR) are strongly correlated with absolute latitudinal midpoint, such that the fastest overall rates of speciation occur in geographic regions with low species richness, cold surface sea temperatures, and high endemism.
Our estimates of speciation rate that used the DR statistic2 were based on a distribution of fully-resolved phylogenies (ATA phylogenies). To assemble the ATA phylogenies, we paired a backbone genetic phylogeny for 11,633 ray-finned fishes with taxonomic information for 19,888 taxa that lacked genetic taxa. Similar to other birth-death polytomy resolvers3, our method generated a conservative distribution of taxonomic placements that satisfied a number of taxonomic constraints. Our original method1 incorporated hierarchical sets of constraints. For example, consider a family of fishes where 60 of 100 species have been genetically sampled, but where two genera within the family are known to be completely sampled (e.g., genus X with 10 species, and genus Y with 5 species). The polytomy resolver described in our article would allocate the unsampled 40 species across the phylogeny under estimated birth-death rates, while preserving the monophyly of genera X and Y.
However, one undesirable limitation of the complex hierarchy of constraints imposed in our analyses is that some higher taxa could not enforce the monophyly constraint. As a consequence, our algorithm would occasionally be forced to break the monophyly of some higher taxa that were nevertheless monophyletic in the genes-only phylogeny. There were three orders where species roamed outside of their order, all belonging to subdivision Percomorphaceae: Blenniiformes (111 out of 951 species), Gobiiformes (547 out of 1,407 species), and Tetraodontiformes (30 out of 376 species). Species from these orders could be placed in monophyletic orders Acanthuriformes, Anabantiformes, Percopsiformes, and Kurtiformes; as well as non-monophyletic orders Centrarchiformes, Pempheriformes, Perciformes, Scombriformes, and Syngnathiformes. The other 47 named orders were not affected by this issue. Collectively, 3.5% of taxa lacking genetic data (688 of 19,888 species) were not maximally constrained across the full distribution of ATA phylogenies.
We implemented an enhanced polytomy resolver4 that could solve more sophisticated sets of monophyly constraints, ensuring that the overlapping, hierarchical constraints would not interfere with each other, and permitting the constraint of previously unconstrained taxa. We generated new ATA phylogenies and re-calculated λDR speciation rate estimates. Our main results derived from λBAMM speciation rate estimates were not affected.
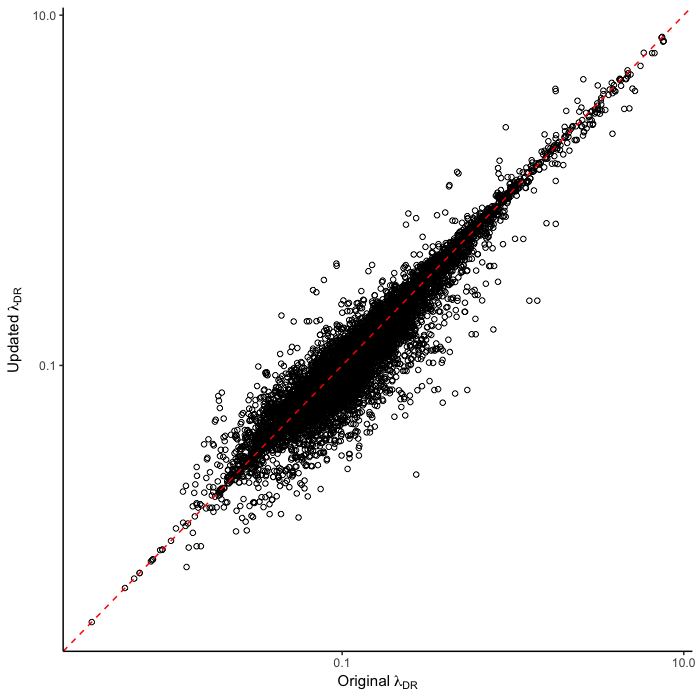
To test for the effect of this improvement, we computed tip-specific λDR speciation rates for the original set of ATA phylogenies and the new set of ATA phylogenies. We summarized, on a per-tip basis, the λDR speciation rate and conducted a linear regression between the original and updated ATA phylogenies. Our linear regression found significant correlation between the original and updated phylogenies (Figure 1; r = 0.98; β = 0.95; p < 0.001).
The original set of ATA phylogenies1 are available in the Dryad data package5. The updated set of ATA phylogenies and updated λDR rates are available in the Downloads section of this website.
Updated text
Based on these new ATA phylogenies, the text of Rabosky et al. 20181 can be revised in the following places:
In the third sentence of the fourth paragraph of the main text, we originally stated that λDR rate for tropical assemblages was 0.11; with our revised estimate, this rate is 0.10. In the fourth sentence, we stated that the λDR rates for shallow-water tropical and high-latitude assemblages were 0.11, and 0.22, respectively. With our revised estimate, these rates are 0.10 and 0.23.
In the fourth sentence of the fifth paragraph, we originally stated that the λDR rate for continental shelf and slope assemblages from the Coral Triangle was 0.11. With our revised estimate, this rate is 0.10. In the fifth sentence, we originally stated that the Arctic assemblages had a λDR rate of 0.24; with our revised estimate, this rate is 0.26. In the seventh sentence, we originally stated that the correlation between λDR and endemism was r = 0.79; our revised estimate for this correlation is r = 0.78.
In the fourth sentence of the sixth paragraph, we originally stated that the correlation between absolute latitudinal midpoint and λDR was r = 0.27. Our revised estimate of this correlation is r = 0.26.
In the first and second sentences of the seventh paragraph, we originally stated that the λDR mean speciation rates of tropical and high-latitude taxa were 0.12 and 0.25. With our revised estimates, these rates are 0.11 and 0.23, respectively.
In the second sentence of the eighth paragraph, we originally stated that the λDR speciation rates for wrasses, gobies, and damselfishes were 0.12, 0.10, and 0.14, respectively. With our revised phylogeny, these rates are 0.13, 0.12, and 0.15. In the fourth sentence, we stated that coldwater taxa were characterized by speciation rates that exceed λDR = 0.34; with our revised estimate, λDR is 0.38. In the sixth sentence, we state the 79.7% of marine speciation events in the ATA phylogenies occurred after the Oligocene-Miocene boundary. In our revised phylogenies, these increase to 80.3% of marine speciation events.
In the fourth sentence of the ninth paragraph, we originally reported the mean rates for high-latitude deep-sea fishes as λDR = 0.37; with our revised estimate, this rate is 0.36.
In the caption for Extended Data Figure 7c, we originally reported that the λDR rate for high-latitude perciform species was 0.30. With our revised estimate, this rate is 0.29.
Updated figures
We revise the following figures:
- Figure 3
- Extended Data Figure 2
- Extended Data Figure 3
- Extended Data Figure 4
- Extended Data Figure 5
- Extended Data Figure 7
- Extended Data Figure 8
- Extended Data Figure 9
- Extended Data Table 1
To compare the original and updated figures, each of the following figures is an animation labeled with the respective ATA phylogeny data source. In some cases, the “original” figures shown here will differ slightly from the figures in the publication1; this is due to randomness introduced to mitigate perceptual artifacts from overplotting.
References
-
Rabosky, D. L., Chang, J., Title, P. O., Cowman, P. F., Sallan, L., Friedman, M., Kashner, K., Garilao, C., Near, T. J., Coll, M., Alfaro, M. E. (2018). An inverse latitudinal gradient in speciation rate for marine fishes. Nature, 559(7714), 392–395. doi:10.1038/s41586-018-0273-1 ↩ ↩2 ↩3 ↩4 ↩5 ↩6
-
Jetz, W., Thomas, G. H., Joy, J. B., Hartmann, K., & Mooers, A. O. (2012). The global diversity of birds in space and time. Nature, 491(7424), 444–448. doi:10.1038/nature11631 ↩
-
Thomas, G. H., Hartmann, K., Jetz, W., Joy, J. B., Mimoto, A., & Mooers, A. O. (2013). PASTIS: an R package to facilitate phylogenetic assembly with soft taxonomic inferences. Methods in Ecology and Evolution, 4(11), 1011–1017. doi:10.1111/2041-210x.12117 ↩
-
Chang, J., Rabosky, D. L., & Alfaro, M. E. (2019). Estimating diversification rates on incompletely-sampled phylogenies: theoretical concerns and practical solutions. Systematic Biology. doi:10.1093/sysbio/syz081 ↩
-
Rabosky, D. L., Chang, J., Title, P. O., Cowman, P. F., Sallan, L., Friedman, M., Kashner, K., Garilao, C., Near, T. J., Coll, M., Alfaro, M. E. (2018). Data from: An inverse latitudinal gradient in speciation rate for marine fishes. Dryad Digital Repository. doi:10.5061/dryad.fc71cp4 ↩